

But despite that, average house prices held up across England – even if there was a drop in sales.
It was the same picture in Crawley however, where prices rose by 0.2 per cent in the year to September 2020. Across the South East, prices rose by 3.4% from £383,338 to £3396,281.
The ONS also publishes house price figures by Middle Layer Super Output Areas (MSOAs) – small geographic areas containing an average of 7,200 people.
These show the 5 of the 13 MSOAs that make up Crawley saw a rise in house prices over the same period. Click here for the average prices for houses in CrawleyHere we reveal which neighbourhoods saw the strongest growth in the year to September 2020. We have also included the other area's figures where prices had dropped.
1. Maidenbower West and Furnace Green
The biggest price hike was in Maidenbower West and Furnace Green where the average price rose to £326,680 up by 5.9% on the year to September 2019. Overall, 91 houses changed hands here between October 2019 and September 2020, a drop of 13%.
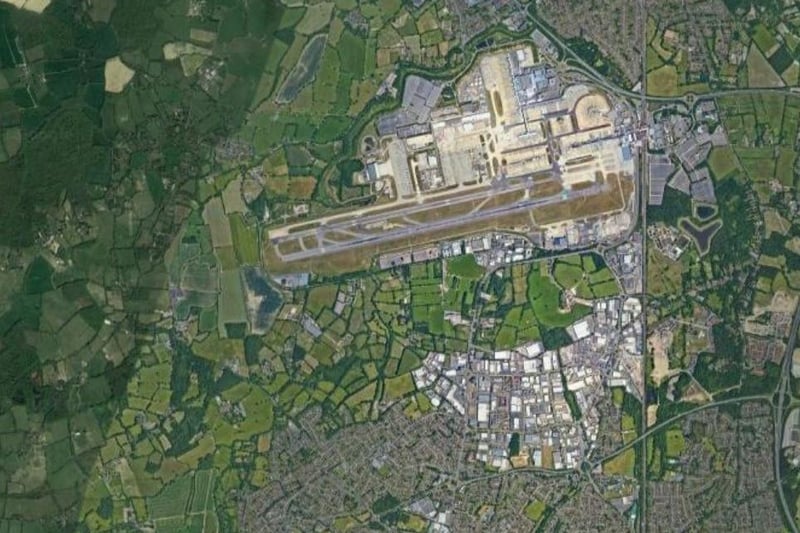
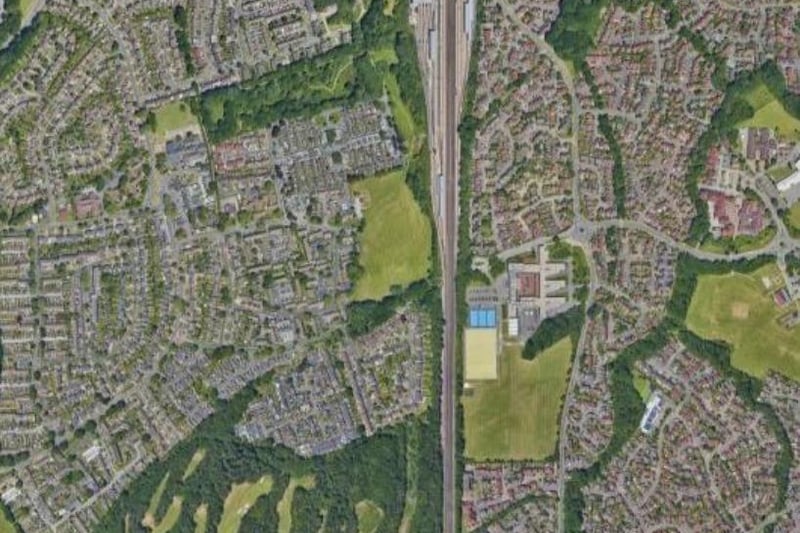
2. Langley Green and Gatwick Airport
The second biggest price hike was in Langley Green and Gatwick Airport where the average price rose to £299,080 up by 4.7% on the year to September 2019. Overall, 38 houses changed hands here between October 2019 and September 2020, a drop of 42%.
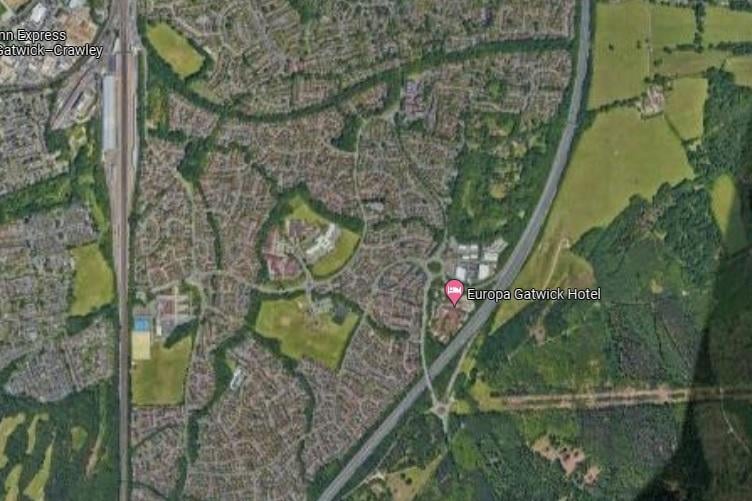
3. Maidenbower East and Worth
The third biggest price hike was in Maidenbower East and Worth where the average price rose to £402,358 up by 4.4% on the year to September 2019. Overall, 85 houses changed hands here between October 2019 and September 2020, a drop of 27%.
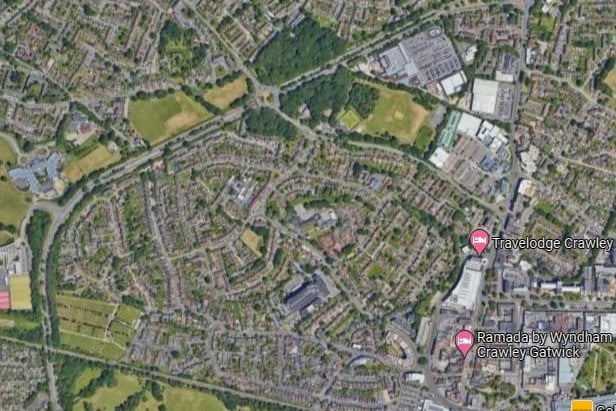
4. Ewhurst and West Green
The fourth biggest price hike was in Ewhurst and West Green where the average price rose to £294,499 up by 4% on the year to September 2019. Overall, 69 houses changed hands here between October 2019 and September 2020, a drop of 36%.